
These tutorials provide step-by-step instructions to familiarize users with the basic layout and functionality of the mapping application. Click play to view the video, or scroll through the written instructions at any time. Select an image to enlarge it in a separate webpage.
Video Tutorial
Written Tutorial
- Introduction
- Explore the Data
- Set the Transparency
- Data Layer Descriptions
- Point Information (Attributes)
- Legend
- Delete Layers
- De-activate Layers
- Theme Maps
- Home
- My Location
- Toolbar
Introduction
Begin the tutorial by getting familiar with the terms and the home screen below. For a closer view, click each image while pressing the control key to open a larger image in a new tab.

Navigate the Map
On the right of the screen is a large map of Washington’s coast and marine waters. There are some key labels on the default map showing the location of basins, canyons, and the Straits.
Some commonly used mouse controls:
- Click and drag to pan over the map.
- Double click to zoom in.
- Shift and left click to draw a zoom-to box.
- Use the mouse wheel to zoom in and out.
- Use the plus sign and minus sign to zoom in and out.
- Estimate distances using the scale bar at the bottom left.
- Find degrees in latitude and longitude at the bottom right.
- Click the button “Download these data” to automatically download a zip file with files of raw data onto your computer. Make sure your computer allows external website pop-ups for this function to work.
- You may also click “Go to Data catalog” to open a new website window that gives users access to each of the available marine spatial planning datasets. This is another portion of the website, located under the Explore button of the msp.wa.gov website.
- A display of active data,
- Washington Marine Spatial Planning banner,
- Your map title,
- Legend of active layers,
- Compass,
- Scale,
- Date.

View Data Layers
The data tab categorizes data layers by data themes along the left side of the screen. Select a data category (such as “Human Uses”). The data category expands into a dropdown list to show all available human use data layers.

Activate Data
To activate a data layer click on the check box left of the data layer.
Data layers associated with the active data layer (in this case, “Aquaculture Districts”) will appear on the map to the right. This will also add a data layer to the Active tab.

Search for Data
If you prefer to search for specific data layers, enter keywords into the search box. For example, type in the word “recreation” into the search box and the data layers that relate to recreation (such as “Recreational Bottomfish and Lingcod Fisheries”) appear in a dropdown menu. Select a data layer to view. It will be activated on your map and added to the active tab.

Explore the Data
Once you have activated the layers you would like to view, select the Active tab.

The last data layer added to the map is the first listed on the active tab. The position on the list also designates the order that data on the map is viewed. Drag and drop data layers to a new position on the list to designate the order that data on the map is viewed. In the diagrams below, the layer “Recreational Halibut Fishing” moves from the first position to the bottom of the list.


Note that the blue areas representing the fishery moves from displaying on top of the green layer, to below all other layers.
Set the Transparency
You can change the transparency of a data layer by clicking on the triangle to the right of the data layer. A table of options appears, click the halfmoon shape labeled transparency.

A popup window will appear. Slide the icon from right to left along the line in the middle of the popup. Data layer colors become more transparent as you slide the icon to the left. Stop in the location you desire and click the X in the top right of the popup window to close. Repeat this for any layer that you would like to be more transparent.

Data Layer Descriptions
For general information about a data layer (such as Aquaculture Districts), click the “i” icon next to the layer and view the data description in the popup near the bottom of the map.

At the bottom of the data layer description popup are two buttons labeled “Download these data” and “Go to Data catalog”.


Point Information (Attributes)
For information on a specific point on the map place your cursor over the point and click the mouse. A popup window will display information about the point you selected, such as the count of vessels in the area (see below). Keep in mind that the area may be very small since some data layers display information for individual points.

Information will also display for points around the location where you clicked. Use the arrows at the top of the popup window to scroll through different points or various active layers to find information about the area surrounding your point. The numbers to the left of the arrows will reveal how many active data points are surrounding your mouse click.

Note: To only display information about one data layer, de-activate the other data layers before clicking. Try to zoom into a specific area before retrieving point information. If you try to click where there are a lot of active data layers at a large scale, a large number of records will be returned (100+).
Legend
For information on the meaning of various shapes and colors on the map, select the “Legend” tab (next to the Active tab). In the map below, the legend displays information regarding all active layers, including yellow shipping density points which represent a low cargo ship vessel density for 2013-2014. The legend will only display the symbology of active data layers that are being viewed on the map.

Delete Layers From Your Active Tab
To delete a data layer from your Active tab select the “X” to the right of the data layer. It will still be available under the Data tab but is no longer in view on your map or on the Active tab.


De-activate Layers
To de-activate the data layer from view without deleting it from your active tab, unselect the check-box to the left of that data layer. The layer will still be available under the Active tab but hidden from view on the map.


Theme Maps
Under development
When complete, this dropdown list will activate a series of pre-selected data layers that focus on important ocean topics for the outer coast of Washington such as fishing, shipping, renewable energy, recreation, and aquaculture.

The “Marine Spatial Planning” option of the dropdown list re-loads the mapping application and returns you to the interactive portion of viewing tool.

Shipping
Shipping is the first available theme map in the dropdown list. Select “Shipping” to load the pre-selected data layers relevant to Washington’s marine shipping industry including commercial deep draft waterway information, annual cumulative shipping data for various types of vessels, and shipping port locations. This is a static map and is intended as a snapshot of the marine sector.

The labels on the left tabs under “Data” now only display categories for Shipping and Basemaps. Click on the Shipping label to expand the list of data layers available under the theme of shipping.

Activate the data on the left tab by clicking on the checkbox to the left of each label. Data will display in the map to the right.

Simply click on the “Marine Spatial Planning” label in the dropdown to return to the original viewing tool.
Home
You can press the “home” button at any time and the map will immediately zoom to the entire Washington coastal extent.

My Location
This button displays your location by activating the Geographic Positioning System (GPS) in your computer. It must be turned on and the popup blocker must be deactivated in order for this function to work. Your location will be added under “My Location” in the data catalog list to the left of the map.

It can be activated and de-activated just like the other data.

Toolbar
The Toolbar consists of other tools that are useful for changing the look of your map, searching for specific geographic areas, saving or sharing your map, and measuring distances. It is located near the top right side of your map and has six icons, which are further explained in this section.
 Basemaps
When you first open the mapping application, the Ocean basemap is the default map under the data theme “Basemap.”

To change the basemap, click the basemap tool on the far left of the toolbar (located in the top right of your map). From there you can choose from a variety of other basemaps by selecting the thumbnail image (in this case, “Streets”). If you change the basemap, the label of the basemap will automatically change under the data tab.

To reactivate the Oceans basemap, select the thumbnail “Oceans.”

 Find Location
There are several ways to find locations in the mapping application. The Find Location function in the toolbar allows you to zoom in and out of particular geographic locations, selecting from latitude and longitude coordinates, geographic regions regions like coastal estuaries, coastal counties, and even by township, range, and section. Click the Find Location tool, input or select the geographic information you prefer, then watch the map immediately zoom in or out to that location. “Show Graphic” allows you to activate a boundary line for the geographic location you selected.
Click the Find Location button to open a dialogue box with various options.

Latitude and Longitude
Select the Latitude and Longitude tab on the left side of the dialogue box, then input information in the spaces that say “Latitude” and “Longitude”.

Once the information is entered, click the “Zoom-To Lat/Long” button. The map will immediately orient and add a blue dot to display the selected coordinates.

A category under “Data” will be added to the data category list labeled “My Data”. This will include the selected latitude/longitude point and possibly “My Location” information from your computer, if activated.

Region
Select the MSP Region tab on the left side of the dialogue box, then click in the space that says “Region”.

Click to select a county or coastal estuary from the dropdown menu of options and watch as the map immediately orients to that location.

County
Select the County tab on the left side of the dialogue box, then click in the space that says “County”.

Click to select a Washington county from the dropdown menu of options and watch as the map immediately orients to that location.

Township
Select the Township tab on the left side of the dialogue box. Click in the space that says “Township”, “Range”, and “Section” and input or select relevant information for each.

Once the information is entered in each box, watch as the map immediately orients to that location.

 Bookmark
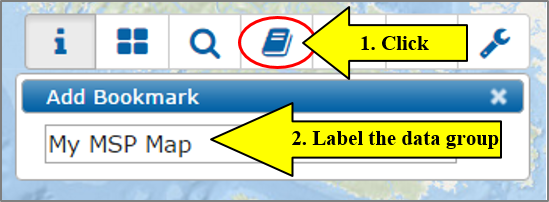
Creating a bookmark lets you to save a group of active data layers under a title you create.
Click the bookmark button. Enter the title of your data group in the popup window. For example, “My MSP Map” will be the title of this group of data layers.
When you click the bookmarks icon, “My MSP Map” will appear in a dropdown menu. Highlight and select the bookmarked map you wish to view at any time and the same group of active data layers will appear. You can close the mapping application and repoen it from the same computer with bookmarks intact.

 Print/Export Map
To export your map in a variety of formats or to print, select the print button. A “Print map” popup window will appear, with a cursor and several options. Type in a title for your map, select a format, the orientation, and size, then select “Print.”

A popup will appear in a new window warning you to turn off popup blockers in your browser.

Your map will open as a popup in a new window. Please be patient: it may take a few minutes for your PDF, JPG, or PNG to appear on your computer based on the number of active layers and the speed of your internet connection. Right click the mouse and select “Save As” to save the document as a computer file.
Once the map is saved on your computer, you can print it, or send as an attachment in an email.

Some key features of the printable map include:
Some data will not display on the print map function. This tool has regular updates to improve the functionality.
 Share this Map
To create a unique web address for a particular version of your map, use the “Share this Map” button in the toolbar. A popup window will appear with a link to your map. Copy the web address (right click, copy) to save the link, then embed it into a web page, email it to your friends, or save the address for your records. The link will never expire and will bring you back to your map again and again.

 Other Tools
Measuring Area
To measure the area of a shape on the map, click the “Other Tools” wrench icon on the far right of the toolbar. A popup window labeled “Measure” will appear. Select the left “Area” button.

Select a point on the map to place the first corner flag of the area to measure. Click your mouse at each consecutive corner in the appropriate shape. Double click on the last point to stop the measurement tool.

The results will appear on the right side of the same “Measure” popup window in the default measurement unit of Acres. To change the measurement unit, click the down arrow next to “Acres” to view other options (such as Sq. Miles, Sq. Kilometers, Hectare, etc.) in a dropdown menu and select the appropriate measurement unit for your task.

Measuring Distance
To measure distance from one point to another on the map, click the “Other Tools” wrench icon on the far right of the toolbar. A popup window labeled “Measure” will appear. Select the middle “Distance” button.
Select the place on the map to place the starting point of the line to measure from on the map. Double click on the point to stop the measure tool. The results will appear on the right side of the same “Measure” popup in the default measurement unit of Miles.

To change measurement units, click the down arrow next to “Miles” to view other options in a dropdown menu and select the appropriate metric for your task.

Latitude and Longitude
The Lat/Long bar in the lower right corner of the map will always display the latitude and longitude degree location of the mouse pointer.

Alternatively, to add a marker to the map at specific geographic coordinates, click the measure tool and click the “Location” button. Use your mouse to select a point on the map. The results will appear in the “Measure” popup window below the latitude and longitude button under “Measurement Results.” To change measurement units, click the down arrow next to Degrees to view and select from other options in a dropdown menu.

Have questions? Contact Libby Whiting at Libby.Whiting@dnr.wa.gov or call 360-902-1589.