

The shipping industry and port authorities in Washington state have a long history, starting by shipping lumber to San Francisco and evolving into the major economic driver it is today. Imports and export pass through Washington waters and Washington ports to and from places around the globe. As shipping continues to expand and support Washington’s imports and exports, it is important to include this expanding use in a spatial plan for Washington’s waters.
Relevant Information
Shipping Specific Information
For specific information about shipping, including a summary and future forecast for containers, breakbulk, grain, dry bulk, and liquid bulk cargo, read the full Sector Analysis Report on Shipping.
Overview of PNW Gateway Trade
The PNW Gateway is one of the largest in the U.S. for international trade, accounting for
$204 billion dollars of goods in 2013. The PNW Gateway includes 11 seaports, airports (SeaTac
International and Portland International as well as several regional airports) and two land
crossings (Blaine and Sumas). Combined, these three accounted for 4.0% of total U.S. exports
and 2.7% of total U.S. imports in 2013.
The goods imported through the PNW Gateway supply inputs to U.S. manufacturers and
products for North American consumers. Exports of agricultural and manufactured products
support farms, businesses and households throughout the Pacific Northwest and the Midwest.
The Pacific Northwest is a key gateway for goods moving between Asia and the United
States. Across all modes of transportation, approximately 10% (by value) of U.S. trade with
Asia moves through the Pacific Northwest (including 13% of waterborne trade of Asia-U.S.
trade). The Pacific Northwest is also one of the top gateways for exports of American products.
Based on 2013 export value, the Pacific Northwest was the fifth largest export gateway across all
modes of transportation, and the sixth largest for waterborne exports.
The Pacific Northwest is the second largest gateway in the U.S. to Northeast Asia (China,
Japan, South Korea, Hong Kong and Taiwan, as well as North Korea and Mongolia) for both
total trade and waterborne trade.
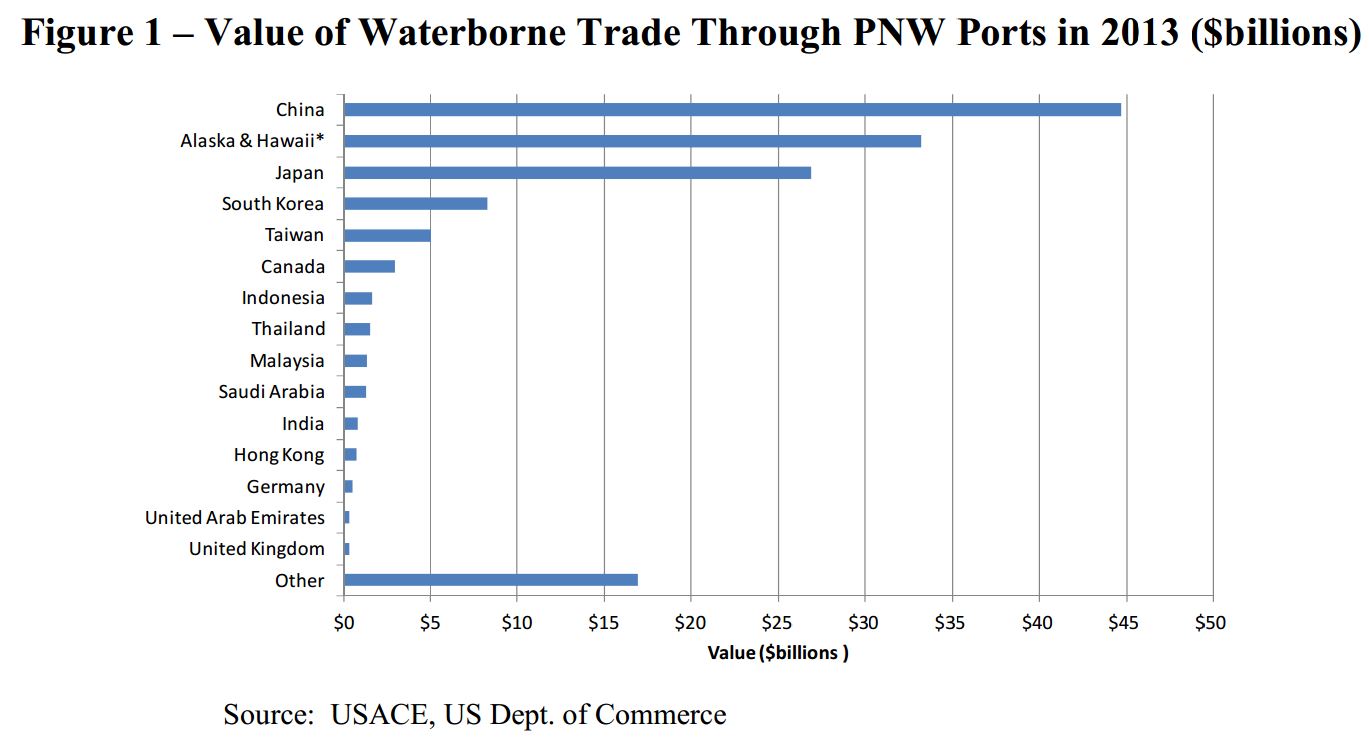
China is the largest trading partner through the PNW ports, accounting for 31 percent of
waterborne trade, followed by Alaska and Hawaii (23 percent), Japan (18 percent), South Korea
(6 percent) and other partners.
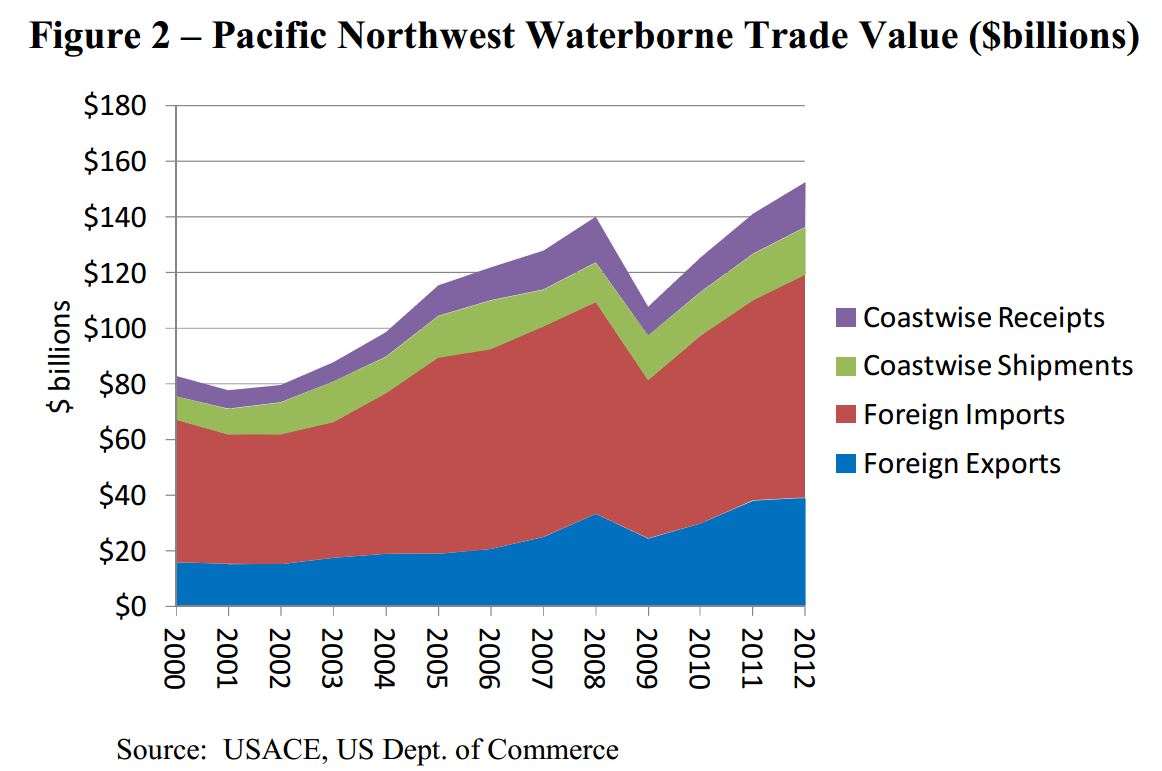
Including both foreign and domestic cargo movements, the value of waterborne trade
moving through ports in the Pacific Northwest grew from an estimated $81 billion in 2000 to
more than $152 billion in 2012. Although the recent recession depressed trade values in 2009
and 2010, strong growth resumed in both 2011 and 2012.
Changing Trade Patterns
Changes in world trade patterns may affect trade flows through the PNW, most notably;
trade with China is being affected. For thirty years, China experienced rapid growth, with its
gross domestic product (GDP) increasing at an average rate of 10 percent. China’s GDP is
expected to grow annually at approximately 7 percent for the near future.3
As its economy has matured, wage rates in China have increased and the exchange rate has
appreciated. These trends are causing multinational firms to consider:
- Shifting production from coastal China to less expensive areas such as western China
or other Asian countries (notably Vietnam and Malaysia) - Reshoring (reloacting production in the U.S.) or
If relocation occurs, it could have two potential impacts on waterborne trade. First, a
transfer of manufacturing to Southeast Asian countries could trigger a shift of vessel traffic from
the Panama Canal to the Suez Canal. Second, a shift to reshore/nearshore would eliminate a
portion of waterborne container trade that was previously sourced overseas. Both of these
impacts could result in decreased trade moving via the PNW.
Thus far there has been only a modest net effect on trade routes due to
reshoring/nearshoring, and future results are still uncertain. Recent research of trade trends
through 2013 indicates that shifts have been minimal:
“Notwithstanding some recent business surveys that show increasing interest in
the re-shoring theme, there is little evidence that it is happening now, or is poised
to occur near-term. Overall, the US-China trade route continues to be dominant,
although we note the emergence of other Asian suppliers, but from a low base (for
instance, Vietnam). Mexico remains a small player in many segments.”
Even the Reshoring Initiative, a proponent of reshoring efforts, suggests that the number of
jobs that were offshored in 2013 roughly equaled the number of jobs reshored, and reshoring
could potentially add 50,000 net new jobs by 2016.6
Some of these jobs are in call centers and professional services and do not affect manufacturing. In addition, a portion of the manufacturing jobs are in assembly but still rely on products manufactured overseas. As a consequence, potential shifts in trade are uncertain.
In contrast to the potential loss of cargo due to reshoring, rising incomes in China and
elsewhere in Asia may lead to increased cargo moving through PNW ports. The growth in
income is stimulating increased consumption of U.S. products, including meat, seafood, grains
and a variety of other consumer products and manufactured goods. This bodes well for exports
of both containerized and non-containerized products from the PNW, which (as noted above)
serves as a natural trade gateway for the PNW through the Midwest.
Improvements to the Panama Canal could also negatively impact the volume of
containerized trade moving the PNW. To a large extent, however, the cargo that would be
vulnerable shifting from PNW ports to ports on the East and Gulf coasts has already done so.
Energy Development
The dramatic growth in energy production in the Bakken region of North Dakota and
Montana, as well as in the Canadian plains provinces, has created market opportunities for the
PNW. Crude oil production increased from around 200,000 barrels per day in 2009 to more than
one million barrels per day in 2013 and is expected to increase further. According to the U.S.
Energy Information Administration (EIA), the “Bakken region now accounts for a little over
10% of total U.S. oil production. The growth of crude oil production in the Bakken region is
part of a longer-term trend in drilling efficiency gains that has led North Dakota to rank second
in crude oil production in the United States, behind only Texas.”
The Williston Basin of the Bakken Formation has an estimated reserve of 3.2 billion barrels
of crude oil. The North Dakota State Pipeline Authority estimated that production in the
Williston Basin could reach 1.4 million to 1.6 million barrels per day around 2023.9 However,
production has increased much faster than predicted in 2012, and some believe that production
could reach 2.0 million or more barrels per day.
This trend is occurring at the same time that Alaska’s oil production is declining. Oil production in Alaska peaked at 2.05 million barrels per day in 1988, but has declined steadily since then. Over the past decade Alaska production dropped from around 1.0 million barrels per day in 2004 to 543,000 barrels per day in 2013. The Alaska State Department of Revenue expects production to continue to decline, falling to 319,000 barrels per day in 2023.10 To make up for the shortfall, refineries on the U.S. West Coast shifted an increasing share of their crude oil inputs to foreign sources. In the PNW this includes crude moving by pipeline from Canada as well as moving by ship from overseas. With the recent growth of crude oil in Bakken region, however, West Coast refineries have quickly shifted to using that source, shipping it in by rail or by a combination of rail and vessel.
In addition to crude oil, marine terminal projects to handle other energy products from the U.S. and Canada are also being considered, including three coal terminals, three methanol plants and exports of liquefied petroleum gases (LPG, consisting of propane and butane). This is creating opportunities for ports as well as for U.S. manufacturers. The increase in North American oil and gas production at significantly lower cost than in competing countries is likely to impact several energy-intensive industries that import and export products, including:
- Iron and steel product manufacturing,
- Resins and synthetic material manufacturing,
- Basic organic chemical manufacturing,
- Plastics and rubber products manufacturing,
- Fabricated metal product manufacturing,
- Agricultural chemical manufacturing,
- Nonmetallic mineral product manufacturing,
- Petroleum and coal products manufacturing, and
- Machinery manufacturing, among others.
There are opportunities to attract energy-intensive industries to the PNW. An example of
this is the plan by Northwest Innovations to develop three methanol plants (planned at Tacoma,
Kalama, and St Helens).
Vessel Transit Forecasts
The figure below presents a summary trend and forecast of vessel calls through PNW ports based
upon data provided in the Washington State Department of Ecology VEAT report for the
Columbia River and by the Marine Exchange of Puget Sound for Puget Sound and Grays Harbor.
PNW Vessel Calls (Entrances)
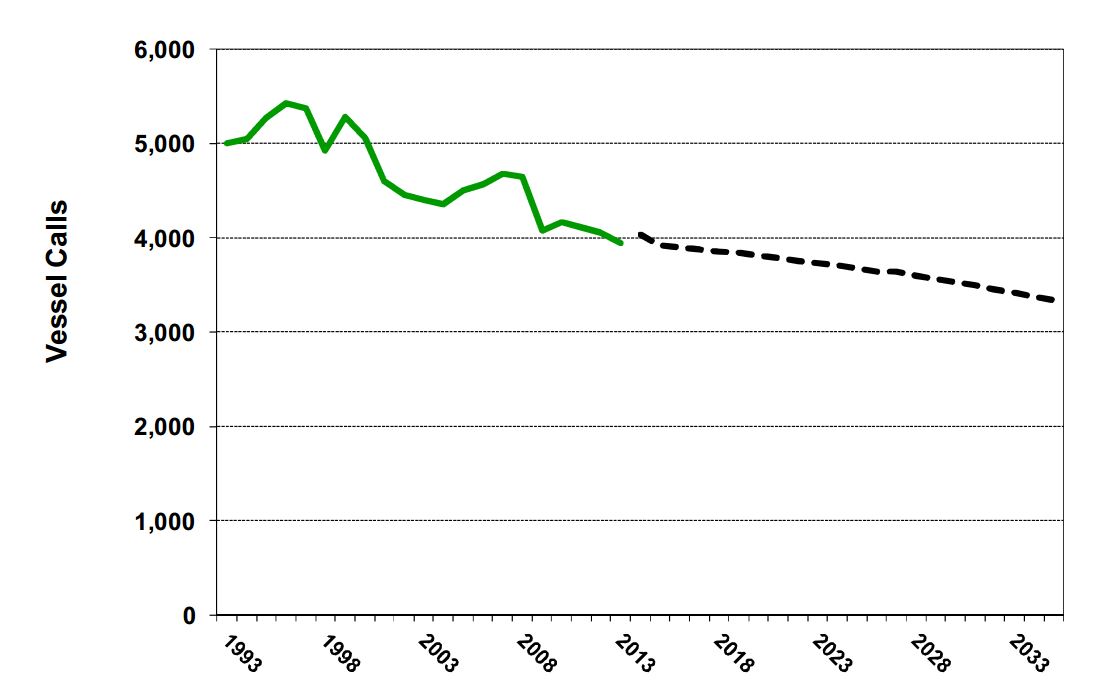
The number of vessel calls (entrances) peaked at 5,431 in 1996 and fell to 3,947 in 2013. This represents a decline of 1,484 vessel calls (average annual trend of minus 1.9 percent per year). As noted above, the decline was due in part to increased vessel size. The forecast indicates a continued decline in the number of calls, reaching 3,336 vessel entrances in 2035. This represents a decline of 611 vessel calls (average annual trend of minus 0.8 percent per year).
Impacts from Offshore Development
This study is tasked with assessing whether development off offshore energy systems would
pose a conflict for marine shipping. This depends on where the energy systems are placed. A
recent report provides the likely area of development as follows: “Results suggest that there is a
wider range of sites with higher suitability scores off the southern half of the Washington coast
than the northern coast, although results differ based on device type. Fixed foundation wind
energy models and nearshore wave device models closely followed this pattern, though it is less
distinct in the mid- and deepwater wave model results. Most areas with high suitability occur
within 25 miles or less of the coast. Results also suggest that the Washington coast has limited
areas suitable for tidal energy development.” The authors of this report indicate that offshore energy systems will likely be located within 25 miles within a seven year window as constrained by existing technology:
“The scope includes projects that would commence a planning or feasibility phase within the next five to seven years. This time horizon serves to narrow the focus to existing, tested technologies deployed within a few miles of shore, with the exception of offshore wind floating platform technology which would most likely be deployed within 20 miles of shore.”
An offshore development located near Coos Bay is expected to be 15 to 18 miles from shore. An awardee of the US Department of Energy’s Offshore Wind: Advanced Technology Demonstration program, Principle Power and its partners have proposed a 30 MW floating offshore wind project approximately 15 miles off the coast of Coos Bay, Oregon. The project will consist of five of Principle Power’s WindFloat floating foundations featuring Siemens 6 MW direct drive offshore wind turbines. Located in deep water, the project will be the first offshore wind farm off the West Coast of the United States. The project will have the following capabilities:
- Project Capacity – Five 6MW WindFloat systems, or 30 MW. This is roughly
equivalent to the power required for 10–12,000 homes. - Distance from Shore – 15 – 18 miles. At this distance, the project will be barely, if at
all, visible from shore. - Water Depth – Approximately 350 meters, or 1,200 feet. It will be located outside of
major commercial activities, including fishing and navigation. - Cable Crossing and Interconnection Point – The cable will be drilled under the beach
and interconnect at a location in the North Spit of Coos Bay. - Power Purchaser – WindFloat Pacific is in negotiations for the purchase of the full
output of the WindFloat Pacific project. - Final Assembly Location – Oregon International Port of Coos Bay.
As offshore technology advances, systems could presumably be developed at greater
distance from the coast. In this event, additional conflicts between offshore energy systems and
the shipping sector could occur.
Most deep draft vessels and barges (carrying liquid bulks) transit well offshore unless
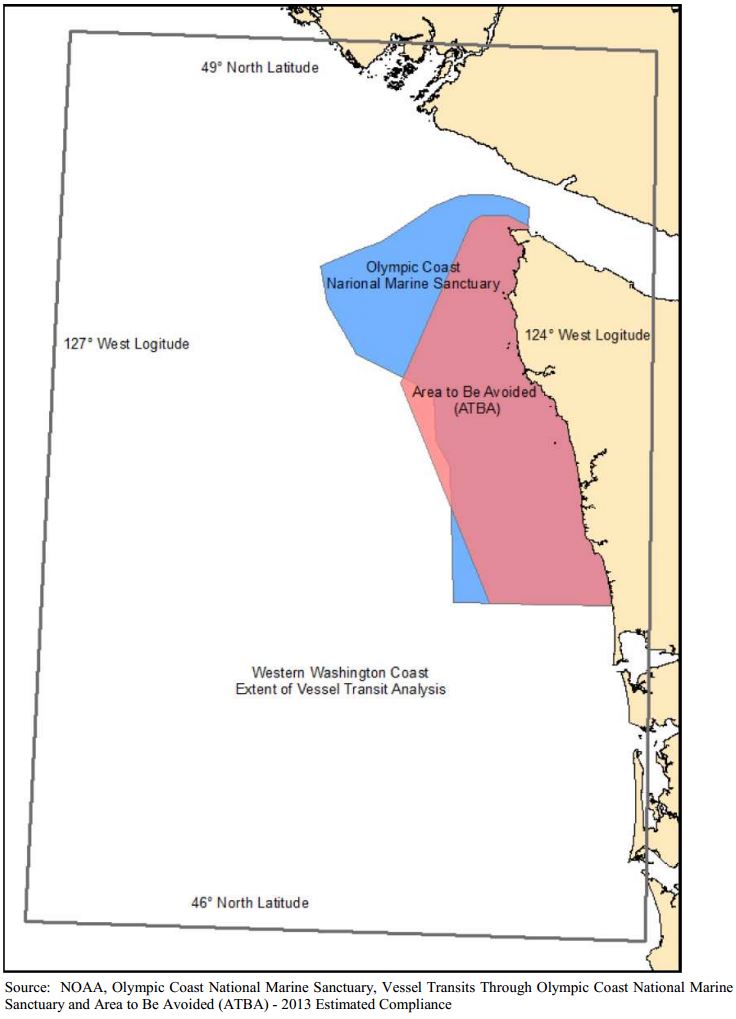
entering/departing a port. For example, off the northern coast of Washington State there is an
Area To Be Avoided (ATBA) that extends up to 25 miles off the coast and tapers down near the
opening to the Strait of Juan de Fuca. Nearly all deep draft vessels comply with the area to be
avoided (ATBA). Those that don’t are quickly notified. The closer off-shore power projects are
to the coast, the less likely there will be conflicts with deep draft vessel traffic.
Two key exceptions are barges carrying dry cargoes, and barges/vessels accessing the Port
of Grays Harbor that must transit the coastal area just below the ATBA. As a result, they could
be impacted by development of offshore energy systems, depending upon where they are placed.
The table below presents a summary of transits off the Washington Coast, including transits through the Olympic Coast National Marine Sanctuary and through the area to be avoided.
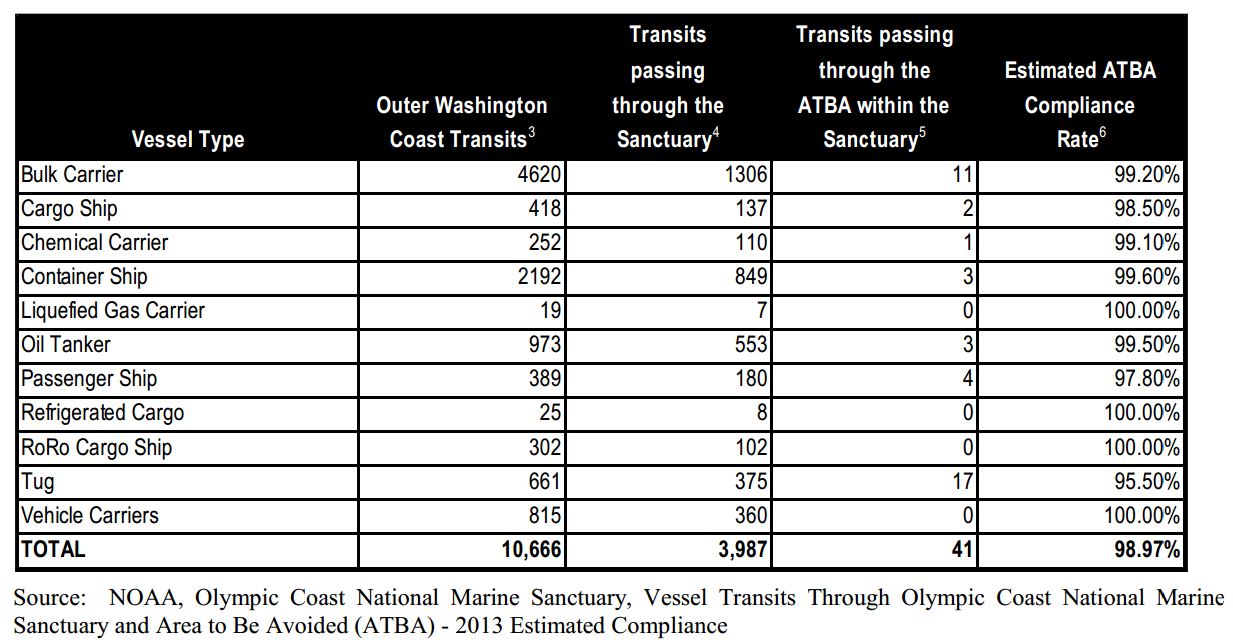
As can be seen, there were 3,987 transits through the sanctuary, but only 41 deep draft
vessel and tug/barge transits passed through the ATBA. The estimated ATBA compliance rate is
very high (nearly 99 percent), which indicates that most traffic is complying with the ATBA.
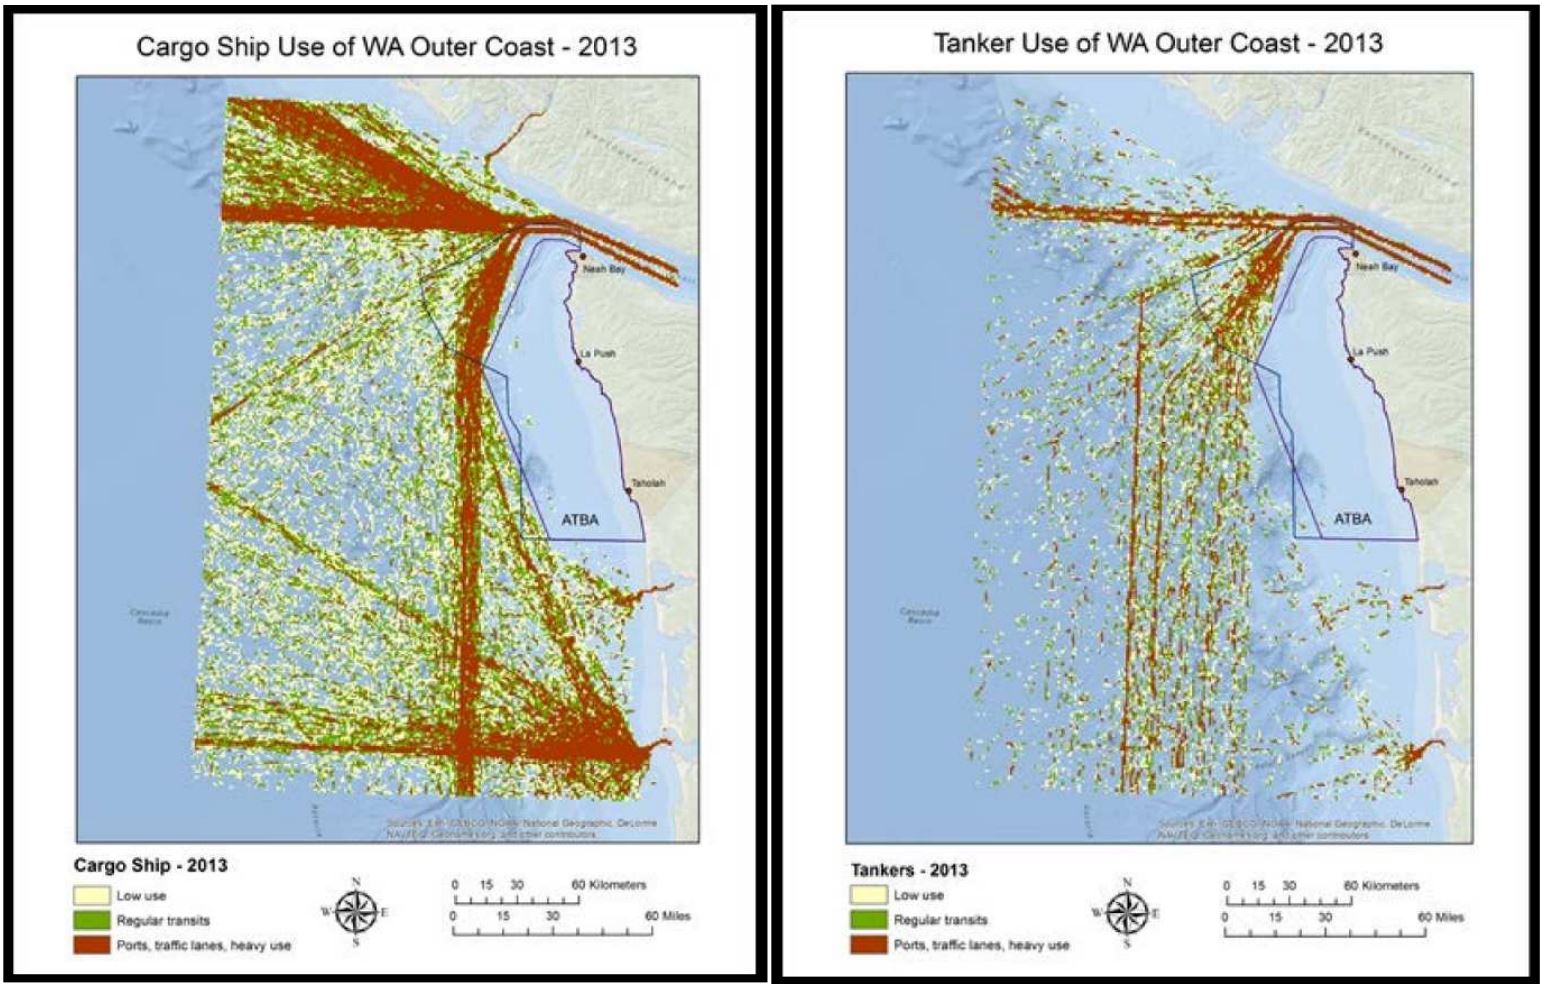
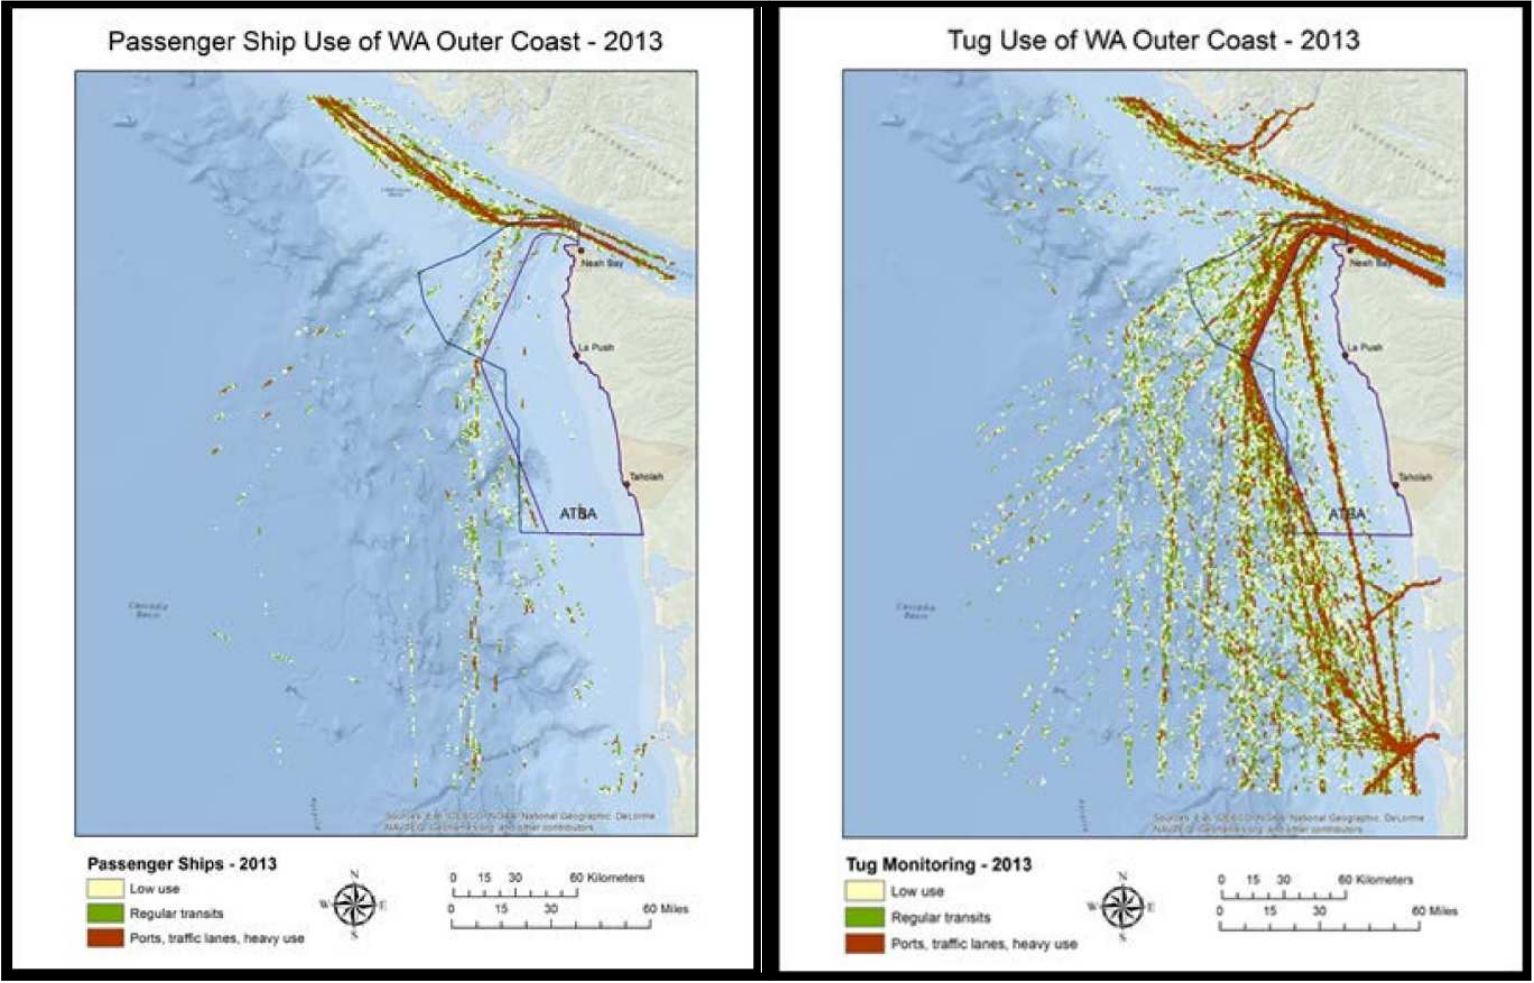
NOAA also maps transit patterns of deep draft vessels engaged in marine transportation
(cargo ships, tankers and passenger vessels) as well tug/barge operations. These maps (see
Figure 9) further illustrate most traffic avoids the ATBA, with exceptions noted above (barges
carrying dry cargoes and barges/vessels accessing the Port of Grays Harbor do transit the
ATBA). In addition, vessels/barges entering the Columbia River currently appear to transit
within 20 miles of the Washington coast in the area south of the ATBA.
Data Gaps and Key Economic Questions
This section provides a summary of the key sources of information that are currently available to support development of an economic analysis of the shipping sector.
Data on shipping activity (tons and value) is provided for most shipping activity. The number of vessel transits is available for marine vessels and barges loaded with petroleum products and for barges on international trade routes (i.e., British Columbia to Puget Sound ports). However, data on the tonnage and transits carrying non-petroleum products on domestic routes (mainly consisting of minerals and forest products) is not well documented.
A summary of relevant economic impact studies is presented in the shipping sector analysis report. Most of the port (and marine terminal) impact studies provide an estimate of the economic contribution of the port and its tenants to the local and regional economies. A few of the reports also estimate the impacts in Washington State or the United States. The statewide reports typically report the importance of trade to Washington State’s economy. Available reports do not provide an estimate of economic losses if shipping lanes were constrained or eliminated as a result of future activities.
The key questions to consider are:
- What are the constraints being considered regarding the location of off-shore energy
systems? Reports for the State have considered location of wind farms within 24
miles of the coast but there are examples of systems reaching out 100 miles. - How would shipping interests (beneficial cargo owners, navigation firms et al)
respond to potential limits- would this cause a reduction or elimination of shipping
activity? Surveys of selected firms and estimation of increased costs would assist in
determining potential responses. - Given potential to changed conditions, what would the loss of economic impacts be?
Could it be mitigated? The impacts of lost market opportunities should be considered
at the local/regional coast levels as well as at the state and national level.
Key Findings
Waterborne cargo volumes in the Pacific Northwest (or “PNW”, defined to include the
states of Washington and Oregon) are projected to continue growing at modest rates during the
study period. Across all cargo types, overall growth is projected to average approximately
1.3 percent per year from 2013 through 2035 under the baseline scenario. In contrast, the
number of vessel transits is expected to continue to decrease due in part to the use of larger
vessels.
There are several new market opportunities, mainly focused on the energy sector. However,
none of these projects is currently permitted and under construction. As a result, there were not
included in the baseline forecast.
Offshore energy systems are considered viable within approximately 20 miles of the coast
but future technology could increase the distance from the coast. Most deep draft vessels and
barges carrying liquid bulks (petroleum, petroleum products and chemicals) transit well offshore
unless entering/departing a port. The closer off-shore power projects are to the coast, the less
likely there will be conflicts with deep draft vessel traffic. Two key exceptions are barges
carrying dry cargoes, and barges/vessels accessing the Port of Grays Harbor that must transit the
coastal area just below the Area To Be Avoided (ATBA), see Figure 10 at the end of the report
for a map of the ATBA.1 As a result, they could be impacted by development of offshore energy
systems, depending upon where they are placed.
Shipping Specific Information
For specific information about shipping, including a summary and future forecast for containers, breakbulk, grain, dry bulk, and liquid bulk cargo, read the full Sector Analysis Report on Shipping.